Images, music, and the limits of video on a 6 GB GTX 1060
TL;DR
- Images were the most practical workload. The 100-image FLUX.3 study completed every request, with a median elapsed time of 55.94 seconds at 512 × 512.
- Repeating the same brief saved time. In 49 FLUX pairs after the initial load, the second seed variant had a native median of 38.49 seconds, versus 70.05 seconds for the first. The runtime reused text encoding.
- Music worked, with a wait. Two 15-second clips took about 10½–11¾ minutes each. The user listened to both and judged them usable.
- Video remained unreliable. Our tested clips took under two minutes to over an hour. Completed files still had motion, anatomy or prompt-following problems; two were colored noise.
- The archive keeps the failures. Of 160 attempts, 152 had accepted results. It retains 153 output files: 140 images, 11 videos and two music clips, including one image whose delivery was cancelled. Seven other attempts produced no retained media.
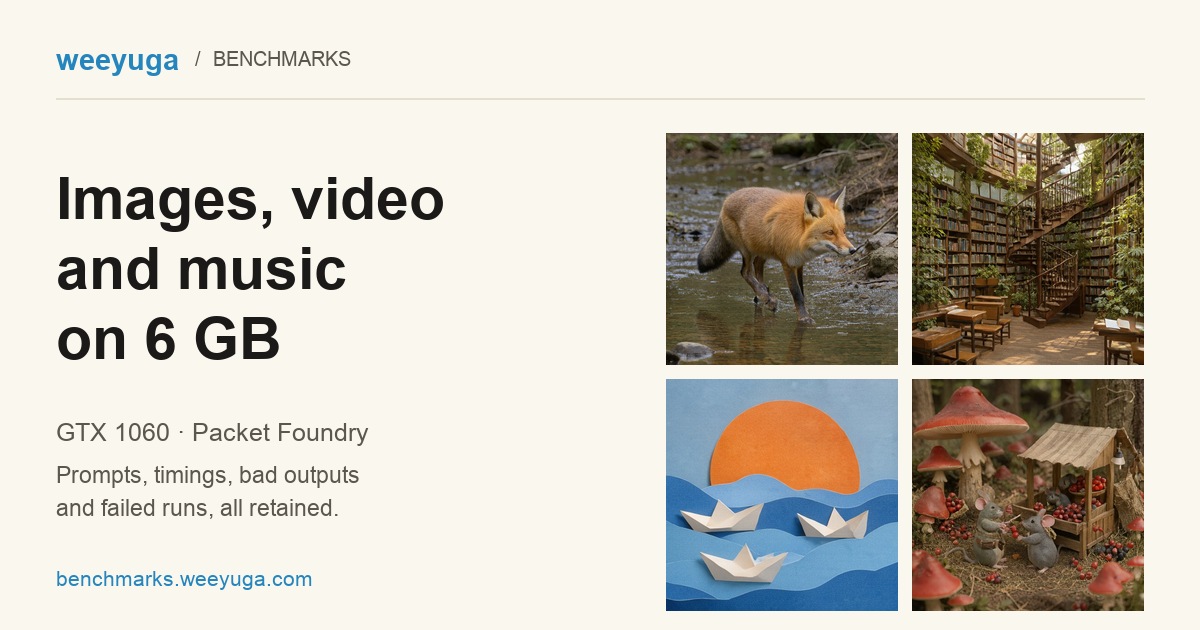
A 6 GB gaming GPU can still do useful creative work, provided the workload and waiting time suit you. In this campaign, it was much easier to make a recognizable image than a convincing short video. The gallery preserves both the good samples and the defects, so you can decide what “useful” means for your project.
The counts describe different things. Accepted results comprise 139 images, 11 videos and two music clips. One additional locally generated image survives despite cancelled delivery. Two pairs of early image files share identical original bytes, so the 153 retained outputs represent 151 unique original media hashes. Contact sheets, the input reference image and synthetic codec fixtures are excluded from these generated-output totals.
Open all retained images, videos, music and failed attempts. Each result includes its prompt, seed, settings and recorded timing.
One machine, through a real application
The recorded setup was Windows 10, a GTX 1060 with 6 GB dedicated VRAM and approximately 28 GiB system RAM, running ComfyUI 0.42.1. Packet Foundry routed the requests, ran them and collected their outputs. LangSmith recorded attempts and saved media attachments.
Two clocks appear in this article. Factory trace time includes adapter work, loading, execution and polling. Native time measures the Comfy graph itself. They have different boundaries, so compare figures carrying the same label.
Other device workloads, operating-system caches and some background downloads remained present. These are observations of a working setup. Different architectures, step counts and runtime state prevent treating the tables as an equal-quality model race.
Images: a full study, beyond the best-looking sample
We gave FLUX.3 klein SD Q4_K_M fifty briefs covering ten scene families, each at five levels of detail. Each brief ran twice, using seeds 42 and 43, producing 100 retained images with no failed or cancelled request in that study. Settings were 512 × 512, four Euler steps and CFG 1.
The briefs ranged from 16 to 463 words: a fox crossing a creek, tea by a rainy window, a botanical library and a paper ocean were among the scenes. The recorded thumbnail review found recognizable scene families in all 100 images. Exact text, anatomy and every requested detail were not formally scored.
| FLUX.3 100-image study | Factory trace time |
|---|---|
| Median across all 100 images | 55.94 s |
| 95th percentile | 99.69 s |
| First request after the fresh process | 242.34 s |
| Median of first seed variants | 74.03 s |
| Median of next seed variants | 39.40 s |
The first request after launching the process took about four minutes. Most later requests reused a loaded model, and every second seed variant reused the brief's text encoding. That distinction explains why “cold” and “warm” need a precise meaning.
Longer, more detailed briefs tended to take longer, but several things changed together. We did not establish a seconds-per-word rule or prove that longer prompts made better images.
Prompt handling and earlier image checks
The application added an eleven-word instruction/source envelope. Observed padded encoder slots ranged from 80 to 640. These include template and padding positions; they are not content-only token counts. We did not rule out every tokenizer-internal truncation path. Accepting a long brief does not prove that every detail reached the model or appeared in the image.
Earlier fresh-prompt pairs used different generators and step counts:
| Initial 512 × 512 image pair | First request | Following request |
|---|---|---|
| FLUX.3 klein SD Q4_K_M, four steps | 278.63 s | 73.01 s |
| Qwen Image 2.1 Q4_K_M, 25 steps | 716.02 s | 392.57 s |
| FLUX.1 dev Q4_0, twenty steps | 719.67 s | 560.32 s |
The same process and loader state remained available within each pair, but the second prompt also changed the fox's color and seed. Fresh conditioning and sampling ran again. These are not matched-prompt quality comparisons. Earlier functionality checks, a delivery interruption and the explicit factory-restart recovery test remain separate from the clean pair statistics.
Want another variation? Keep the prompt and runtime together
Changing the seed gives another image from the same brief. In all fifty FLUX pairs, the second request reused both positive and negative text conditioning while sampling ran again; every pair produced two different retained images.
After excluding the initial-load pair, the 49 remaining pairs had a first-image native median of 70.05 seconds and a second-image median of 38.49 seconds. The median within-pair saving was 32.12 seconds. These native times differ from the Factory trace statistics above.
| Measured FLUX.3 population | First/new-brief native median | Same-brief second native median |
|---|---|---|
| All 50 pairs | 71.67s | 38.40s |
| 49 pairs excluding initial loading | 70.05s | 38.49s |
This suggests a useful workflow: keep a brief's seed variations together on the same running factory and profile. The cache lives in that runtime. Changing the composed prompt, switching models or factories, restarting or evicting cached state can remove the benefit. We measured two variations per brief; we did not measure a five-image batch.
Cache evidence and the gap between requests
Positive conditioning executed fifty times and was reused fifty times; negative conditioning executed once and was reused ninety-nine times. Recorded fresh positive-conditioning intervals had an approximate median of 31.69 seconds. Excluding the first pair, the median per-pair speed ratio was 1.85×.
The actual first-completion-to-second-start gaps ranged from 10.422 to 31.712 seconds, with a 22.380-second median. These were consecutive requests, not zero-gap batch execution. The savings track skipped positive encoding, but seed order was not randomized and there was no matched cache-disabled control. A copied encoder-probe duration on a cached request refers to the earlier encoding, not extra work during the second request.
Qwen Turbo also benefited from a repeated brief
We added ten Qwen Image 2.1 Turbo Q4_K_M images at 512 × 512, eight Euler steps, CFG 1 and the recorded ManualSigmas schedule. All ten files passed delivery, checksum and decode checks. The original images were also reviewed, with their material, geometry and prompt-following defects kept beside them in the gallery.
The first image took 320.246 seconds native, including loading and encoding. The next seed of the same brief took 95.234 seconds, after a 34.322-second gap. Eight subsequent new briefs had a median of 199.712 seconds, ranging from 194.865 to 223.135. A cached variation's time should therefore not stand in for the time needed by a new brief.
The first-to-second change combines initial loading and text-cache reuse; it does not isolate the text cache alone. The ten outputs also passed actual saved-attachment retrieval and the native ten-case experiment check. Inspect the ten Q4 images or read the pair and cache evidence.
Q4 versus Q8: more precision did not guarantee a better result
We repeated the same ten prompts and seeds with Q8_0 generator weights, keeping the eight-step settings, CPU encoder/VAE and FP32 computation. The eight new briefs had a median native time of 446.477 seconds with Q8, compared with 199.712 seconds with Q4. The cached second seed was much closer: 93.391 versus 95.234 seconds.
The runs happened at different times, with different inherited loading and cache state. An interruption also left a long gap between two Q8 cases, although the generation completed and its saved result was collected. The measurements show this setup's elapsed times; they do not isolate a causal speed penalty from changing quantization.
More stored weight precision is not an aesthetic score. Both sets have visible defects, and Q4 is not a high-precision ground truth. Compare the ten image pairs or download their exact timing and cache context.
Q4/Q8 settings, all timing tables and memory-counter limits
Ten further Q8_0 outputs reuse the exact ten Q4 prompts, seeds 42–51, order and eight-step Euler/CFG1 ManualSigmas settings. The earlier Q4 originals remain unchanged. Only the generator file and output prefix differ in the executed graphs; both sets retain the same CPU INT8 encoder, CPU VAE and FP32 runtime settings. All ten Q8 results passed actual relay/acknowledgement, full decoding/checksums, output-attachment retrieval and paired native ten-case LangSmith experiment checks. Both sets of originals were inspected visually, with defects retained beside each output.
| Matched workload | Q4 native time | Q8 native time |
|---|---|---|
| Initial request; actual inherited loading/cache context | 320.246s | 541.410s |
| Same first brief, next seed | 95.234s | 93.391s |
| Eight subsequent new briefs, retained-runtime median | 199.712s | 446.477s |
The Q8 same-brief follow-up started 24.958s after its predecessor finished; its native encoder-cached flag was true. These are whole native graph times; Factory traces have separate boundaries. The first Q8 request inherits the existing Comfy/runtime state, so its loading and text-cache history need not match the earlier Q4 first request. Offloading, cache, initialization and other device workloads remain possible timing confounders.
During case 5, the local status coordinator stopped after three connection errors while the native generation continued and completed successfully. Warehouse and native-history readbacks confirmed one successful attempt. The unchanged finite coordinator collected that saved result before submitting case 6, preserving the same factory runtime. The actual case 5-to-case 6 native idle gap was 890.033s; every inter-run gap is retained in the comparison data. This monitoring interruption created no additional generation attempt or failed-generation record.
Fresh-prompt CPU encoding was slower in this Q8 series. The earlier Q4 fresh-brief encoding intervals ranged from 100.109 to 115.984s; the Q8 range was 119.328 to 457.125s. The eight new briefs give these observer-interval medians:
| Observed phase, eight new briefs | Q4 median | Q8 median |
|---|---|---|
| CPU text encoding | 103.109s | 247.344s |
| Sampling, including loading | 68.703s | 108.328s |
| VAE decoding | 28.329s | 50.414s |
These intervals include preparation/loading and observer delivery overhead. They locate the extra elapsed time without establishing its cause. A Q8 snapshot recorded many total memory faults but few hard page inputs; it does not establish disk paging as the bottleneck. Windows PagefileUsage/PrivateUsage counters mean private commit charge, rather than measured disk-pagefile residency. See Microsoft's process-memory counter definitions and working-set/fault definitions.
Q8 stores more weight precision, but it is not automatically a prettier image. Q4 is not a high-precision ground truth, and no aesthetic score or whole-VRAM residency claim follows from the comparison. The Q8 packed file alone is 7.12 GiB, before live working memory. This is still two seed variants for the first brief, not a measured five-image batch. Per-case material, geometry, text and prompt-adherence findings remain visible for both quants.
Smaller generator files are available at the same pinned Unsloth revision. We inspected their published metadata; these Q2/Q3 variants were not generated in the earlier Q4/Q8 comparison. The later Q2 experiment is described below:
| Available generator quant | Packed file size, decimal GB |
|---|---|
| Q2_K | 2.47 GB |
| Q3_K_S | 2.72 GB |
| Q3_K_M | 3.17 GB |
| Q3_K_XL | 3.61 GB |
File size leaves out dequantization buffers, compute workspaces, activations, encoder/VAE and other GPU use. A smaller packed file is a candidate for a future residency test, not proof that its entire active stage fits a 6 GB GPU.
Compare all ten Q4/Q8 image pairs · Download exact matched timings, cache context and pair mapping.
Q2: a smaller generator, with a different loading policy
A further ten Q2_K images used the same prompts, seeds and sampling settings. This run also started a new Comfy process, changed the loading policy and added memory instrumentation. Its timing differences therefore cannot be credited to the smaller quant alone.
| Matched workload | Q4 native | Q8 native | Q2 native |
|---|---|---|---|
| Initial request; actual process/cache state | 320.246s | 541.410s | 217.040s |
| Same first brief, next seed | 95.234s | 93.391s | 90.960s |
| Eight new briefs, retained-runtime median | 199.712s | 446.477s | 196.433s |
The recorded parameter checks placed the generator on CUDA, and peak Torch allocated memory was 3.278 GiB. Windows memory sampling had gaps and query errors. Those observations do not prove that every weight remained in physical dedicated VRAM for the entire run. All ten retained outputs passed the recorded delivery and file checks; their visual defects remain visible.
Inspect the Q4/Q8/Q2 image triples or download the matched timings and memory observations.
Q2 loading, memory coverage, setup failures and verification details
Ten Q2_K outputs reuse the exact ten Q4/Q8 briefs and seeds 42–51; the twenty earlier originals remain unchanged. The dimensions, eight Euler steps, CFG1, sigma schedule, CPU encoder/VAE and FP32 compute remain fixed. Q2 also uses a new Comfy process, default normal VRAM with a 0.6 GiB reserve, forced full-generator loading and explicit instrumentation. Those runtime changes matter when reading the timing table.
| Matched workload | Q4 native | Q8 native | Q2 native |
|---|---|---|---|
| Initial request; actual process/cache state | 320.246s | 541.410s | 217.040s |
| Same first brief, next seed | 95.234s | 93.391s | 90.960s |
| Eight new briefs, retained-runtime median | 199.712s | 446.477s | 196.433s |
At the observed load boundary, sampler entry, all eight post-denoiser/pre-Euler-update callbacks and final completion, Q2’s registered generator parameters and buffers were on CUDA with zero partial-offload accounting. Peak Torch allocated memory across the ten requests was 3.278 GiB. The original sampler and callbacks remain in use; synchronization/inventory checks add measurement overhead.
Real one-second target per-process WDDM observations preserve their actual successful-sample gaps and idle baseline. The three-second coverage check passed for 7/10 whole-graph windows and 9/10 generator windows; the largest measured gaps were 6.406083s and 6.074722s respectively. Coverage failures stay marked as failures. The completed observer retained 3 query errors in total; 3 graph windows and 1 generator window contained errors. Failed queries remain errors rather than synthetic samples. A separate post-run analysis retains the unchanged strict verifier's outcome and distinguishes these coverage windows; no additional image was generated to repair a measurement gap.
The largest observed shared-memory increase over that process/adapter baseline in a generator window was 4.0 MiB. These are observations at sampled times, not bounds on unobserved gaps or proof that every generator weight remained physically in dedicated VRAM throughout execution. Idle shared usage can already be nonzero. The exact coverage and counters are included beside each result.
A setup gate first rejected the unsupported --normalvram argument before generation. Removing --lowvram selects this pinned version’s normal default. The first WDDM observer also stopped after a CIM counter-query error, with zero verified samples and zero observed generation requests; its cause remains unresolved, and its failed state, logs and source remain retained. These are setup/measurement failures outside the generation-attempt count. Twelve source-hash differences were verified as exact LF-to-CRLF serialization changes, with native byte hashes still pinned.
All ten outputs passed actual relay/acknowledgement, full PNG decoding/checksums, trace attachment retrieval and three comparable native ten-case experiments. Every original was visually inspected, with defects retained. No automatic aesthetic winner or isolated quantization-speed effect follows from these unrandomized runs at different times. Only the first two requests share a brief; five variants were not measured.
Compare all ten Q4/Q8/Q2 image triples · Exact matched timings, stage intervals and residency observations.
Music: two usable clips, about eleven minutes each
YuE2 INT8 ConvRot produced two 15-second stereo FLAC clips at 48 kHz. Factory traces took 700.26 and 634.17 seconds: 11 minutes 40 seconds and 10 minutes 34 seconds. Native graph durations were 696.921 and 630.994 seconds.
The user listened to both files and judged both usable music. That is a judgment about these two samples. We did not score lyric accuracy, genre fidelity or comparative musical quality. Successful decoding and clean signal checks cannot replace listening.
An earlier CPU semantic-generation trial was cancelled before producing audio. Moving that stage to the GPU made complete samples possible. The recorded semantic-generation and conditioning stages still dominated, at about 586 and 558 seconds; acoustic sampling and CPU decoding were smaller portions. The runtime retained loader state, but the second request changed style wording and seed, so those generation stages ran again.
Video: the file can finish while the scene still fails
Every accepted video below is 512 × 320, but length, frame rate, architecture and settings differ. Treat these as records of the tested configurations.
| Video configuration | Output length | Factory trace time, seeds 42 / 43 |
|---|---|---|
| Wan2.1 T2V 1.3B baseline, FP32 compute | 81 frames at 16 fps | 64m 06s / cancelled |
| Wan2.1 T2V 1.3B Q8_0 | 81 frames at 16 fps | 37m 18s / 34m 16s |
| LTX-Video 2B 0.9.8 distilled Q8_0, text | 121 frames at 24 fps | 3m 01s / 1m 46s |
| Same LTX, text plus image | 121 frames at 24 fps | 2m 01s / 1m 45s |
| CogVideoX2B Q8_0, original bounded-attention bridge | 49 frames at 8 fps | 41m 24s / 39m 48s |
| CogVideoX2B Q8_0, corrected reference-DDIM bridge | 49 frames at 8 fps | 40m 40s / 39m 54s |
Wan: the baseline fox barely changed in inspected samples. The Q8 clips showed motion with shape inconsistencies. One follow-up was cancelled after the first baseline's hour-long wait. The second Q8 request followed an idle gap of roughly fifty minutes, so cached conditioning alone does not make it an immediate warm-run comparison.
LTX: the distilled configuration was much faster, using a single base-resolution pass rather than the official multiscale/upscaling pipeline. Its runtime stayed loaded from the text tests into the image-conditioned tests. Sampled frames showed recognizable foxes, but direction, anatomy and continuity still failed. Fast completion did not establish a usable walking sequence.
CogVideoX: after an initial attention-allocation failure, the first completed pair was colored noise. A source audit found differences from the reference implementation in positional embeddings, diffusion coordinates, noise schedule and solver. Correcting the bridge while retaining the same Q8 weights removed the noise in sampled frames. This does not isolate which change fixed it or justify blaming quantization alone.
The corrected Cog clips still missed the requested full-body walk: one fox exited and reappeared with a tail-like defect; the other was mostly empty snow with a cropped fox. Reviews sampled five frames per clip. Continuous, full-rate natural motion remains unverified. The corrected pair used the same runtime with a 46.902-second gap; the second request reused conditioning while sampling and decoding ran again.
Why a smaller model file does not guarantee a fast video
Q8 describes stored generator weights. These Pascal-compatible runs still computed in FP32, with separate precision and placement choices for other components. Quantizing a checkpoint does not shrink every activation or remove the work of a slow sampler.
Loading stages separately helps memory pressure, but it is not proof that the active stage fits entirely in dedicated VRAM. In the corrected Cog run, generator peak allocated memory was about 2.73 GiB, while decoder reserved memory reached about 7.52 GiB. Allocated and reserved memory are different counters, and Windows may page CUDA memory. We did not measure isolated kernel times or demonstrate a causal quantization speedup.
The unsuccessful attempts are part of the result
MiniMax H3 produced no accepted media. Its first native attempt failed while opening an approximately 27 GB text encoder, with Windows error 1455 at the file-open/mapping path. That indicates a paging-file capacity failure there, rather than a demonstrated GPU out-of-memory failure. A later dynamic-loading attempt went further but was cancelled by the user because it was too slow. Neither attempt establishes a completion time.
The archive also retains the cancelled YuE2 CPU trial, Cog's initial attention failure, two LTX storage-guard cancellations, an interrupted Qwen delivery and the cancelled Wan follow-up. Some stopped before generation; one produced local media without completing delivery. Those statuses remain distinct.
Accepted results passed checksum, full-decoding, collection and acknowledgement checks. Saved LangSmith attachment bytes were independently decoded, and native experiment exports were checked where recorded; the media-player UI was not separately inspected. The noisy Cog clips passed file checks while failing visual usefulness. Both facts belong beside the files.
Browse the complete campaign · How we measure · More findings